Direct answer
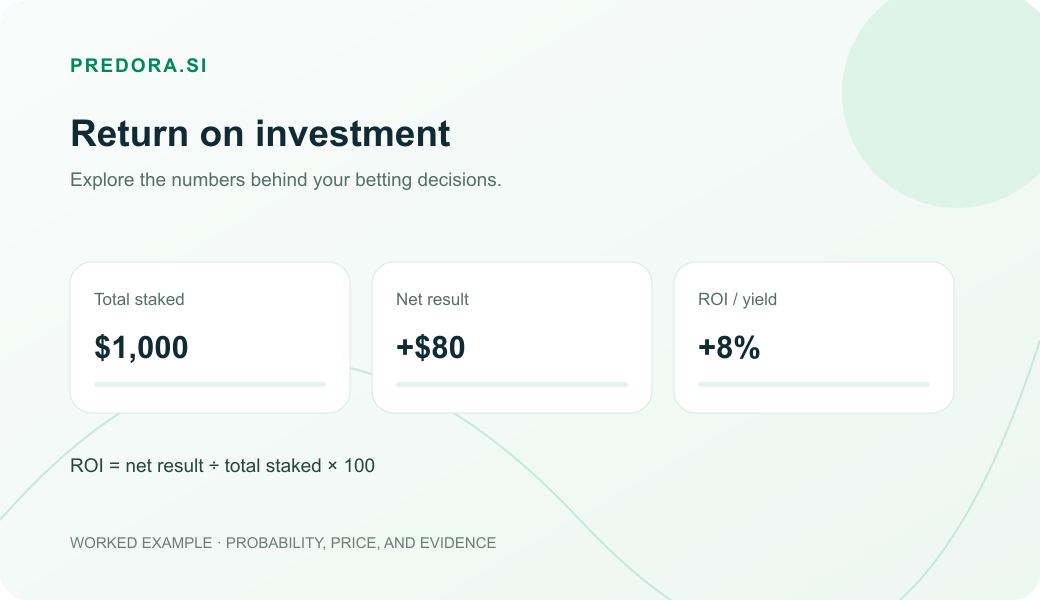
Return in betting is the percentage that shows how much a strategy yielded or lost relative to the total amount staked.
It considers odds, wins, losses, and the analyzed base. In simple terms: it doesn't just measure how many bets won, it measures whether the set produced a result.
Quick summary
| What it measures | How much a strategy yielded or lost as a percentage. |
|---|---|
| Main formula | Return (%) = net result / total staked x 100. |
| What it depends on | Odds, wins, losses, stake, and base size. |
| Why it matters | Because hit rate alone doesn't show whether the strategy was good. |
| On Predora.si | The model's historical performance appears as Return. |
How return in betting works
Return looks at the final result of a set of bets. When you use 1 unit per match, wins gain according to the odds and losses lose 1 unit.
Then, the net result is compared with the total staked and becomes a percentage.
Return in betting formula
When all bets have 1 unit, the logic becomes simple: net profit divided by the number of bets.
Return (%) = (net result / total staked) x 100 If you win: profit = odds - 1 If you lose: profit = -1Example in football
Imagine 5 bets of 1 unit: two wins at odds 3.00 and three losses. Profit becomes +1 unit on 5 staked, or a return of +20%.
The hit rate was only 40%, but the return was positive because the wins came at higher odds.
| Bet | Odds | Outcome | Profit |
|---|---|---|---|
| 1 | 3.00 | Won | +2.00 |
| 2 | 2.20 | Lost | -1.00 |
| 3 | 2.00 | Lost | -1.00 |
| 4 | 1.70 | Lost | -1.00 |
| 5 | 3.00 | Won | +2.00 |
How it relates to Predora.si
On Predora.si, the Active Model's performance appears as Return: simulated historical result considering the odds, by league, market, and filter.
- Performance organizes Base, Hit Rate, and Return by league.
- The Return History shows the simulated weekly evolution.
- Return uses odds and base, so it changes when the filters change.
Return is not the same as hit rate
Hit rate shows how many bets won. Return shows how much the set yielded or lost.
| Metric | What it shows | Limitation |
|---|---|---|
| Accuracy rate | How many bets won. | It doesn't consider the price of the odds. |
| Return | How much the strategy yielded or lost. | It fluctuates in small samples. |
| EV | Mathematical expectation before the bet. | Depends on the quality of the estimated probability. |
Common mistakes
Looking only at hit rate
A strategy that hits often can have weak return if the odds are too low.
Assessing Return without its sample and period
Return describes the model’s simulated historical result over the sample shown. Compare periods and segments to explore its consistency.
Practical checklist
- Check the betting base.
- Check the market, league, and filter.
- Compare return with hit rate.
- Odds used and their respective periods.
- Base and duration of the analyzed filter.
FAQ about Return in betting
Is return in betting the same as profit?
Not exactly. Return is a percentage metric relative to the total staked, good for comparing strategies.
Does a positive return mean the next bet will win?
No. It shows a positive result in a filter, but the next bet is still subject to variance.
Can you have a positive return with a low hit rate?
Yes, when the wins come at odds good enough to offset the losses.
Can you have a high hit rate and a negative return?
Yes. If the odds are too low, hitting often may not be enough.
How do hit rate and return differ?
Hit rate measures frequency; return measures the percentage result considering the odds. The two metrics answer different questions.
Return shows the economic outcome
Hitting more can be comfortable, but return shows whether the odds compensated for the risk. Read return alongside base, market, and hit rate.