Direct answer
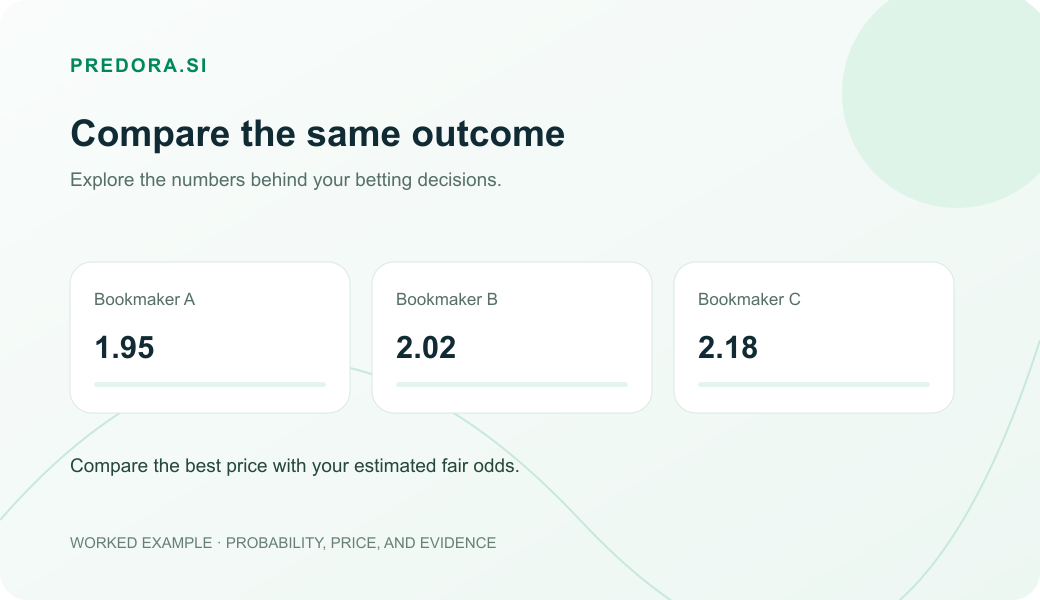
Comparing odds in football is observing how the same selection, in the same match, market and line, is priced by different bookmakers. The highest observed quote, by itself, does not indicate value; its reading depends on the relationship with the estimated probability, the fair odd and the EV.
Quick summary
| Point | What it means | Formula or rule | How Predora.si helps |
|---|---|---|---|
| Compare odds | Observe the same selection quoted at different bookmakers. | Same match, market, line and selection. | The odds comparison shows prices per bookmaker in the same match. |
| Highest observed quote | Highest available quote for that selection. | Highest quote among the listed bookmakers. | The app displays the observed quotes for comparison. |
| Implied probability | Chance embedded in the bookmaker's odd. | 1 ÷ decimal odds | Helps compare the bookmaker's price with the model's chance. |
| Fair odds | Quote consistent with the estimated probability. | 1 ÷ estimated probability | The Active Model calculates the fair odd per market. |
| Edge | Difference between the model's chance and the bookmaker's chance. | Model probability minus implied probability. | Shows the difference between the model's probability and the implied probability. |
| EV | Expected value of the bet. | (probability × odd) − 1 | Upcoming Matches with EV+ displays markets with positive EV according to the model's calculations. |
Comparing odds in football is analyzing how the same selection is priced by different bookmakers and relating those quotes to the fair value estimated by the model's probability.
What does comparing odds in football mean?
In football, the odds is the price of the bet. Many people in Brazil also call it price. When you compare odds, the initial question is simple: how are different bookmakers pricing exactly the same selection?
| Home | Market | Selection | Odds |
|---|---|---|---|
| Bookmaker A | 1x2 | Flamengo wins | 2.10 |
| Bookmaker B | 1x2 | Flamengo wins | 2.18 |
| Bookmaker C | 1x2 | Flamengo wins | 2.25 |
In this example, the highest observed quote is 2.25. A higher quote changes the theoretical gross return for the same stake, but it does not by itself demonstrate that value exists. The price-probability relationship depends on comparing the quote with the estimated probability.
Rule number 1: compare the same bet
The most common mistake is comparing similar bets as if they were the same thing. To compare odds properly, it must be:
- Same game. Flamengo x Palmeiras does not compete with another match of the day.
- Same market. 1x2, Double Chance, Over, BTTS, and corners answer different questions.
- Same line. Over 2.5 goals is not the same as Over 3.0 goals.
- Same selection. Home, draw, away, over, under, yes and no should not be mixed.
- Same match period. Full match and first half are different universes.
| Situation | Correct reading |
|---|---|
| Bookmaker A: Over 2.5 goals @ 1.95; Bookmaker B: Over 2.5 goals @ 2.08. | Valid comparison. Same market, same line and same selection. |
| Bookmaker A: Over 2.5 goals @ 2.05; Bookmaker B: Over 3.0 goals @ 2.20. | Invalid comparison. The line changed, so the risk changed. |
| 1x2 @ 1.80; Double Chance @ 1.45; Both teams to score @ 1.85. | Different markets. These odds do not compete directly with each other. |
In Predora.si, this logic is central: when you change the market, the question asked of the match changes, the probability changes, the EV changes and the reading of the factors also changes.
How do odd differences affect the theoretical return?
Because odds are price. Imagine two people doing the same analysis, on the same match, with the same estimated probability. The only difference is the odd each one took.
| Bettor | Odd caught | Bet | Return if it wins | Profit if you win |
|---|---|---|---|---|
| Person A | 1.90 | $100 | $190 | $90 |
| Person B | 2.05 | $100 | $205 | $105 |
The difference in the example is not in the match prediction, but in the quote considered. Keeping the other conditions the same, different quotes change the theoretical return and, over a series of observations, also change the accumulated result.
The mathematical logic behind the comparison
Truly comparing odds is not just picking the highest quote. The complete process involves implied probability, fair odd, edge and EV.
Implied probability = 1 ÷ decimal oddsFair odds = 1 ÷ estimated probabilityEdge = model probability − implied probabilityEV = (estimated probability × odds) − 1| Concept | Question it answers | Common mistake |
|---|---|---|
| Highest observed quote | What is the highest observed quote? | Thinking that the highest quote, by itself, indicates value. |
| Implied probability | What chance is this odd pricing? | Forgetting that the odd carries the bookmaker's margin. |
| Fair odds | What price would make sense given the estimated chance? | Using fair odds without examining the probability estimate. |
| EV | How does this quote compare with the estimated chance? | Thinking that positive EV always wins. |
Example: Over 2.5 goals
Imagine a Brasileirão match with the market Over 2.5 goals. The odds comparison shows:
| Home | Market | Line | Odds |
|---|---|---|---|
| Bookmaker A | Total goals | 2.5 | 1.90 |
| Bookmaker B | Total goals | 2.5 | 2.02 |
| Bookmaker C | Total goals | 2.5 | 2.08 |
The highest observed quote is 2.08.
If the model estimates 52% chance for Over 2.5 goals, the calculation goes like this:
Implied probability = 1 ÷ 2.08 = 48.1% Fair odd = 1 ÷ 0.52 = 1.92 Edge = 52.0% − 48.1% = 3.9 p.p. EV = (0.52 × 2.08) − 1 = +8.16%The offered price exceeds the estimated fair odds in this example. Compare model calibration and match factors to assess the potential value.
How to analyze an odds comparison in football
1. Market analyzed
The comparison starts from a defined market: 1×2, goals, both teams to score, or corners.
2. Line consistency
For goals and corners, different lines represent different events and risks; Over 2.5 and Over 3.0 are not equivalent.
3. Odds by bookmaker
With match, market, line, and selection held constant, the odds can be compared across the monitored sources.
4. Highest observed odds
The highest odds only identifies the highest observed price; it does not, on its own, determine whether value exists.
5. Implied probability
The relationship 1 ÷ odds expresses the implied probability associated with the price.
6. Comparison with the model probability
The difference between the probability estimated by the model and the implied probability shows the divergence between model and market.
7. Fair odds and EV
Fair odds and EV make the relationship between estimated probability and price easier to compare.
8. Factors and context
The reading may consider home/away, form, season, league, sample, H2H and other signals.
9. Odds updates
Odds change quickly; when the price changes, implied probability, edge, and EV can also change.
How to apply this on Predora.si
On Predora.si, odds comparison fits into the match analysis flow. The idea is not to look only at the price, but at the relationship between price, probability, fair odds, EV, and factors.
| Area | How it helps |
|---|---|
| Upcoming Matches | Explore matches, markets, leagues, probability, EV, and the highest observed odds in the context of the Active Model. |
| Odds Comparison | Shows monitored bookmakers and available odds for the selected market. |
| Models | Shows model probability and fair odds to compare against the bookmaker's price. |
| Upcoming Games with EV+ | Displays markets with positive EV according to the Active Model, for comparison between estimated probability and price. |
| AI + Statistics / Factors | Helps assess whether the mathematical reading matches the match context. |
Example: if a model shows 39,6% / 2,52, that means it estimates a 39.6% probability and calculates fair odds of 2.52. If an observed price is above 2.52, there is a positive divergence relative to the fair odds of 2.52 according to that model.
Markets where the logic applies
The logic applies to any market, but Predora.si's current focus is on these five:
| Market | What to compare | Key comparison |
|---|---|---|
| 1x2 | Home win, draw, or away win. | Don't confuse favorite with value. |
| Double Chance | 1X, X2 or 12. | Protection can get too expensive. |
| Over 2.5 goals | Same goal line. | Don't compare 2.5 with 3.0 or 2.75. |
| Both Teams to Score | Yes or No. | Compare whether both teams show production consistent with the market. |
| Over 9.5 corners | Same corner line. | Corner volume is not the same as goal volume. |
On Predora.si, you see probability, EV, fair odds, and observed prices per market in football matches.
Common mistakes when comparing odds
1. Thinking the highest odds is always the best bet
The highest odds is the best available price. It only becomes interesting when it is above the estimated fair price.
2. Compare different markets
Odds of 1.80 in 1x2 is not the same as odds of 1.80 in Both Teams to Score. They are different questions about the match.
3. Ignore the line
Over 2.5 goals and Over 3.0 goals are not the same bet. The risk has changed.
4. Looking only at the favorite
The favorite can win and still be a bad bet if the odds are squeezed.
5. Ignoring negative EV
If the probability is good, but the odds pay too little, the EV can turn negative.
6. Forgetting that odds change quickly
When the bookmaker adjusts the price, the implied probability, the edge, and the calculated EV can also change.
7. Not comparing with factors
Compare EV with match context. Where the factors differ, investigate what explains the gap.
Analytical checklist for odds comparison
- Market: 1×2, Double Chance, Over 2.5 goals, Both Teams to Score, or Over 9.5 corners.
- Line: the comparison is valid when the line is the same; Over 2.5 is not equivalent to Over 3.0.
- Selection: home with home, BTTS Yes with BTTS Yes, Over 9.5 with Over 9.5.
- Highest observed odds: identifies the highest price among the monitored sources.
- Implied probability: 1 ÷ odds.
- Model probability: comparison between the estimated probability and the implied probability of the price.
- Fair odds: difference between the market price and the estimated fair odds.
- EV: expected value calculated for the analyzed price.
- Factors and context: home/away, form, season, league, sample, and other relevant signals.
- Updates: changes in the price modify the associated calculations.
Formulas to copy
Implied probability = 1 ÷ decimal oddsFair odds = 1 ÷ estimated probabilityEdge = model probability − implied probability of the oddsEV = (estimated probability × odds) − 1FAQ: odds comparison in football
What is comparing odds in football?
It is comparing how the same selection is priced by different bookmakers, keeping match, market, line, and selection constant.
Is the best odds always the best bet?
No. Best odds only means that bookmaker is paying more. The bet only becomes interesting when that odds is above the fair price estimated by the model probability.
How do I know if an odd has value?
An odds can have value when the estimated probability is higher than the bookmaker's implied probability. Another way to see this is to compare the bookmaker's odds with the fair odds: if the bookmaker pays above fair value, positive EV may exist.
Can I compare odds from different markets?
Not directly. Different markets have different risks and logic. An odds of 1.80 in 1x2 is not the same as an odds of 1.80 in Over 2.5 goals or Both Teams to Score.
Why do odds change?
Odds change because the market adjusts. Factors include betting volume, news, lineups, injuries, bookmaker movement, and changes in perception about the match.
How does Predora.si help compare odds?
Predora.si brings together odds from several bookmakers, shows the best available odds, and helps compare Active Model probability, fair odds, edge, EV, and factors per market.
Closing
Comparing odds does not identify a 'sure bet.' The comparison shows how the same market is priced by different bookmakers and allows relating those prices to estimated probability, fair odds, EV, and the statistical context.
Predora connects model probabilities, bookmaker prices, and match context so you can investigate potential value with the evidence in view.