Direct answer
High probability is when a modeled scenario has a high estimated chance of happening. Value bet is when the odds are paying above the estimated fair price.
In football, a bet can have 70% chance and still be bad if the odds are too low. In analysis, it's not enough to look at what seems most likely; the relationship between estimated chance and price also matters.
Quick summary
| Concept | What it means | Formula or logic | When to use | Common mistake | How Predora.si helps |
|---|---|---|---|---|---|
| High probability | Scenario with a high estimated probability. | Chance estimated by the Active Model. | When the goal of the analysis is to observe higher-probability scenarios. | Confusing high chance with a betting indication. | High Probability organizes games with higher estimated probabilities. |
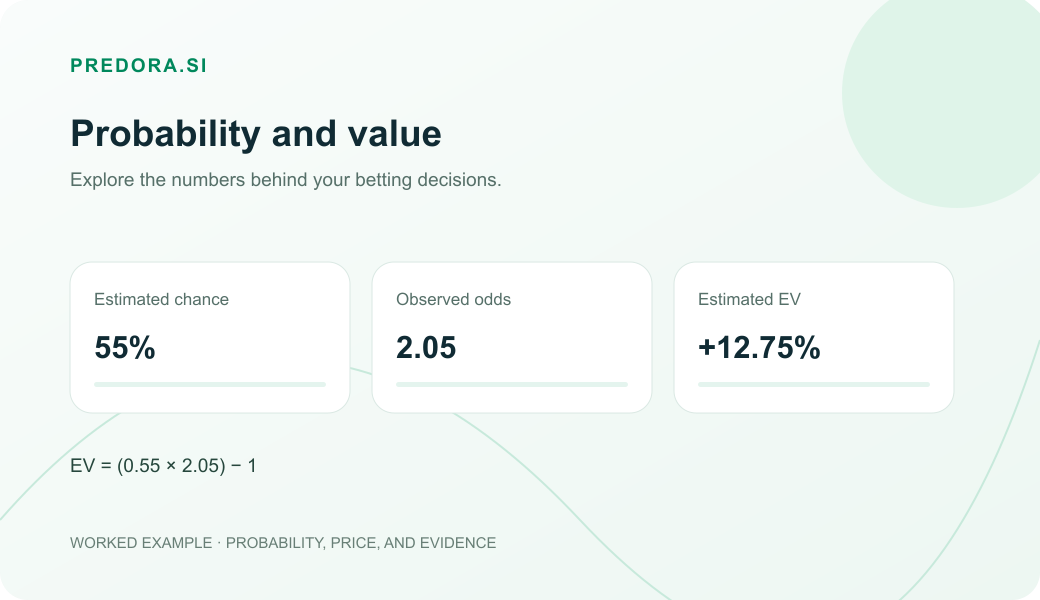
| Value bet | Odds paying above the estimated fair price. | EV = (probability × odds) − 1. | When the goal of the analysis is to compare estimated probability and odds. | Assessing EV without checking the probability estimate. | EV+ shows positive divergences between estimated probability and odds. |
| Combined reading | Estimated probability and odds analyzed together. | Model probability greater than the odds' implied probability. | When the goal is to compare both metrics together. | Looking only at the odds or only at the probability. | Upcoming Games, odds comparison, and AI + Statistics help contextualize the analysis. |
High probability measures the estimated chance of occurrence; value bet compares the odds with that estimated chance.
High probability is not the same as value
This distinction is important to understand how estimated probability and odds relate in football.
High probability answers: does this have a good chance of happening?
Value bet answers: is the bookmaker paying more than it should for this chance?
It looks similar, but it is not. A very strong favorite can have a 75% chance of winning. However, if the bookmaker offers very low odds, the relationship between estimated chance and odds can be unfavorable. A high hit rate, on its own, does not describe the economic outcome of the sample.
A bet with a 47% estimated chance can offer positive EV when its odds exceed fair value. Compare the probability estimate with the offered price to assess that opportunity.
In mathematical analysis, the most likely outcome is only one part of the reading; the observed odds must also be compared to the estimated probability.
Formula or logic
To compare high probability with value betting, you need to look at three numbers:
Implied probability = 1 ÷ decimal oddsFair odds = 1 ÷ estimated probabilityEV = (estimated probability × odds) − 1How to read this in practice
- Estimated probability: chance calculated by the model.
- Implied probability: chance embedded in the bookmaker's odds.
- Fair odds: odds consistent with the estimated probability.
- Positive EV: when the offered odds are above what would be fair for that chance.
If the model's probability is higher than the implied probability of the odds, there may be an estimated difference.
Football examples
Compare three illustrative football scenarios to see how probability and price work together.
1. High probability, but no value
Market: Double Chance
Modeled outcome: home or draw
Estimated probability: 70%
Offered odds: 1.30
EV = (0.70 × 1.30) − 1 EV = 0.91 − 1 EV = -0.09 EV = -9%This scenario has a high estimated probability, but the odds are below the fair odds calculated for the example.
2. Lower probability, but with value
Market: 1x2
Modeled outcome: away win
Estimated probability: 48%
Offered odds: 2.30
EV = (0.48 × 2.30) − 1 EV = 1.104 − 1 EV = +0.104 EV = +10.4%The chance of it not happening remains relevant. In this example, the odds are above the calculated fair odds, resulting in positive EV.
3. Probability and odds together
Market: Over 2.5 goals
Estimated probability: 62%
Offered odds: 1.75
EV = (0.62 × 1.75) − 1 EV = 1.085 − 1 EV = +8.5%In this example, the estimated probability and odds produce positive EV. Compare the price with fair odds, then explore the match factors behind the estimate.
Comparison table: high probability vs value bet
| Question | High probability | Value bet |
|---|---|---|
| What is the focus? | Chance of happening. | Odds price relative to the chance. |
| What are the odds usually like? | Lower. | They can be low, average, or high. |
| Can it have negative EV? | Yes. | No, when the relationship indicates a positive estimated value. |
| Can it lose? | Yes. | Yes. |
| Is it more emotionally comfortable? | Generally yes. | Not always. |
| What does the calculation indicate? | Only the estimated chance of occurrence. | The relationship between estimated probability and odds, expressed as an expected return. |
| Page most connected on Predora | High Probability | EV+ |
Why can a bet with 75% be bad?
Because there is still a 25% chance of it going wrong. A bet with a 75% chance loses 1 in every 4 times, on average, if the probability is well calibrated.
Now comes the key point: if the odds are too low, the wins do not pay enough to compensate for the losses.
| Estimated chance | 75% |
|---|---|
| Fair odds | 1 ÷ 0.75 = 1.33 |
| Offered odds | 1.22 |
| Reading | The bookmaker is paying below the estimated fair price. |
Even with a high occurrence rate, the relationship between estimated probability and odds is unfavorable in this example.
Why can a value bet lose?
EV describes the average return implied by a probability estimate and price. Individual results fluctuate, so comparing a series of bets helps you assess the approach.
What matters is the process:
- Did the estimated probability make sense?
- Were the odds above the fair odds?
- Was the selected market coherent?
- Did the game factors support the reading?
- Was the observed odds still the same at the time of the analysis?
Positive EV shows when the offered odds exceed the fair price implied by your probability estimate.
How to interpret historical metrics
In short samples, higher-probability scenarios tend to occur more often, but that alone does not inform the economic outcome.
In historical analysis, hit rate and return are different metrics and should be interpreted separately.
Sample
Shows how many games entered that sample and gives weight to the reading.
Hit
Shows consistency, but does not tell the economic story on its own.
Return
Shows the historical result of the sample considering the captured odds.
Price
Even a sample with many hits can show negative returns when the observed odds are unfavorable.
How to interpret this on Predora.si
On Predora, this difference appears in the comparison between High Probability, EV+, Upcoming Games, Performance, and AI + Stats.
1. High Probability: look at higher estimated probabilities
High Probability brings the Active Model’s most likely outcomes into focus. Compare their odds and match factors to evaluate the price.
2. EV+: analyze price-probability divergences
EV+ highlights prices above the Active Model’s estimated fair odds, helping you find potential value to investigate.
3. Upcoming Games: compare the metrics
In Upcoming Games, you can view the games in the sample and compare Chance and Value (EV).
4. Performance: contextualize the model's history
Performance shows Base, Hit Rate, and Return by league and sample, helping to contextualize the reading.
5. AI + Stats: review the context
For an analyzed game, open the analysis and check whether the factors of the selected market are consistent with the model's reading.
Positive EV is only an analytical measure. The reading should also consider odds, statistical factors, market, and game context.
Factors to contextualize each market
| Market | Useful factors |
|---|---|
| 1x2 | Relative strength, home/away, recent form, and consistency. |
| Double Chance | Solidity, home advantage and ability to avoid defeat. |
| Over 2.5 goals | Creation, goals scored, goals conceded, and pace. |
| Both Teams to Score | Whether both sides create and also concede chances. |
| Over 9.5 corners | Volume, pressure, crosses, and attacking dynamics. |
Common mistakes
1. Assessing low odds without comparing probability
Low odds indicate that the market also considers that scenario likely. That does not mean the price is good.
2. Reading EV without checking its assumptions
Positive EV indicates an estimated difference if the probability is well calibrated. Even so, an EV+ bet can lose.
3. Comparing different markets as if they were the same
Odds of 1.80 on Over 2.5 Goals are not the same as odds of 1.80 on 1X2. Each market has different logic, risk, and factors.
4. Looking only at chance and ignoring return
Hit rate is important, but it does not tell the whole story. In betting, return depends on the odds.
5. Looking only at EV and ignoring context
Positive EV can appear in a game with conflicting factors, a weak base, or odds that have already changed. Comparison still matters.
6. Mixing analysis criteria
Mixing metrics without criteria makes interpretation difficult. First define the goal of the analysis; then use the corresponding sample.
7. Forgetting that odds change
The calculated EV changes when the odds change. Record or check the odds and the time used in the analysis.
Practical checklist
- Define the goal of the analysis: compare high probability, EV, or both?
- Choose the market: 1x2, Double Chance, Over 2.5 goals, Both Teams to Score or Over 9.5 corners.
- Check the Active Model's chance: does it make sense for the market?
- Compare with the odds: are the odds above the fair odds?
- Check the EV: is it positive, negative, or close to zero?
- Compare in Performance: what is the Base, Hit Rate, and Return in the chosen sample?
- Open AI + Stats: do the factors support the reading?
- Compare odds: what is the highest observed odds and what is the collection time?
- Explore the evidence: divergences between chance, price, and context reduce the consistency of the reading.
FAQ about high probability and value betting
Is high probability better than value betting?
Compare the price with the estimated probability. A likely outcome can still have a poor price; value betting helps you make that distinction.
Can a value bet have low probability?
Yes. A bet can have a 45% or 48% chance and still be good if the odds are paying well above the fair price. The point is the price compensating for the risk.
Why can a bet with a 70% chance have negative EV?
Because the odds can be too low. If the bookmaker pays as if the chance were higher than the model estimates, the expected value becomes negative.
Does High Probability mean lower risk?
Higher estimated probability means the model considers an outcome more likely. Compare that probability with the odds to assess its value.
Does EV+ mean higher risk?
EV and probability answer different questions. Probability describes how likely an outcome is; EV compares that estimate with the offered price.
How should I interpret when probability and price seem aligned?
Compare the estimate with the odds, match factors, and the model’s historical performance to assess the opportunity.
A value bet is a concept of comparison between probability and price
Value betting connects your view of a match with its price. Predora brings probabilities, odds, and match factors together so you can investigate potential value.
Predora.si combines model probability, observed prices, EV, and statistical factors to facilitate comparative analysis.