Direct answer
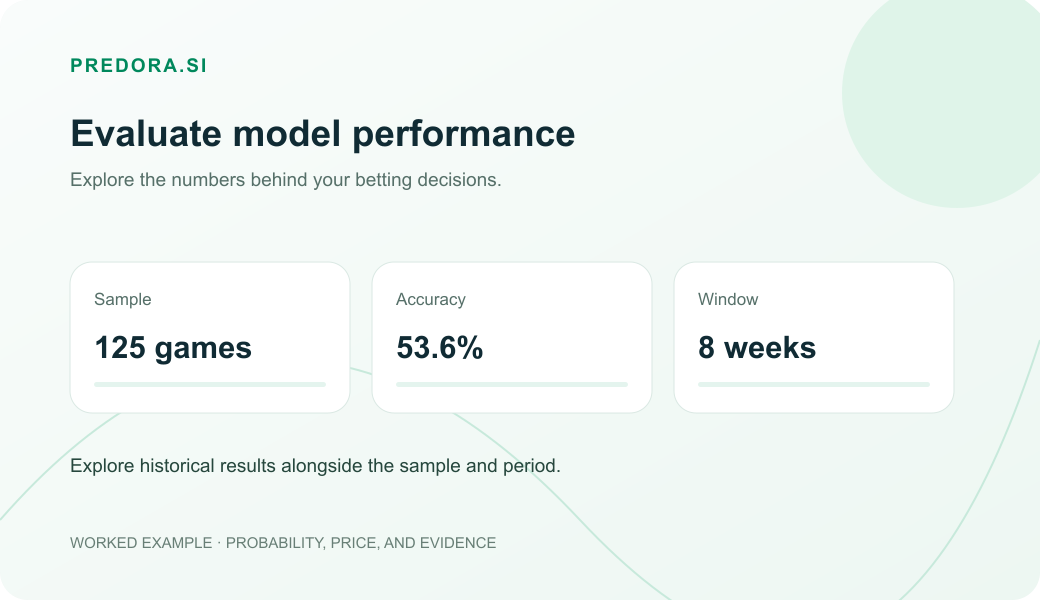
The page Performance from Predora.si shows in which leagues the Active Model has been performing better, using three key numbers: Sample, Hit and Return.
Instead of looking at game after game in the dark, you use this screen to organize your analysis by league in football.
Definition in one sentence: Performance by League is the Predora.si screen that shows where the active model is performing best by championship, combining sample size, hit rate, and simulation.
Quick summary
| Point | What it means | How to use it in practice |
|---|---|---|
| Performance by league | League ranking based on the active model's performance. | Compare championships where the model has been performing better before opening game by game. |
| Sample | Number of games in the sample. | Compare leagues using sample size and time period to assess how much evidence supports each result. |
| Hit | Percentage of analyzed results that hit. | Read it alongside simulation, because a high hit rate with low odds may not pay off. |
| Return | Economic result of the sample considering odds. | Use it to evaluate the historical result of the reading over the long term. |
| All, High Prob, and EV+ | Tabs that change the type of analysis. | Separate overview, high probability, and positive expected value without mixing criteria. |
What is Performance by League?
Performance by League is a strategic dashboard within Predora.si. It shows where the Active Model has delivered a stronger reading, so you can organize analysis by championships and samples.
The product logic becomes clearer when you separate each page:
AI Radar
Organizes games into statistical samples for comparison.
Performance
Helps you understand in which leagues the model has been performing better.
Upcoming Matches
Shows the broad view to explore league, market, and match.
Upcoming Games with EV+ and Upcoming Games with High Probability
Focus on positive EV or high-probability games, depending on your goal.
The question becomes: "in which leagues does the model show better historical performance in this sample?".
What do Base, Hit Rate, and Return mean?
Sample
Base is the number of games included in that calculation. The larger the base, the more statistical weight the reading tends to have.
- small sample: compare more periods to assess how consistently the pattern appears;
- medium base: a trend can already be observed;
- larger sample: more observations to assess how consistently the pattern appears.
Hit
Hit Rate is the rate of analyzed results that matched within that sample. A league with a 62% hit rate hit 62 out of every 100 similar entries, but hit rate alone does not tell the whole story.
Return
Return is the model's simulated historical result considering the odds. It complements the frequency of hits in reading the sample.
Reading by league = Base + Hit Rate + ReturnThere is no single magic number. The ideal approach is to look at all three signals together before comparing leagues.
| Scenario | How to interpret |
|---|---|
| Small sample + High hit rate | It can be good, but it is still too early to trust it too much. |
| Large base + Medium hit rate + Return above zero | Could be an interesting sample to start the analysis. |
| Large base + High hit rate + Return below zero | May indicate poor odds or low economic compensation. |
| Small base + very high Return value | Could just be positive variance. |
| Robust base + Return above zero in EV+ | More consistent historical signal in the value sample. |
What do the All, High Prob, and EV+ tabs mean?
The Performance tabs change the sample used to analyze leagues.
All
Shows the overall view of the league within the active model. Use it when you want to understand how the model has been performing in that championship without applying a more specific filter.
High Prob
Shows the sample of games with the highest estimated probability. Use it to compare the historical performance of that segment.
EV+
Shows the sample of games with positive expected value. Use it to compare leagues where the observed odds were above the fair price estimated by the model.
How to evaluate the evidence
Do not compare different tabs as if they were the same thing. Each one answers a different question about the same league.
Performance, AI Radar, and analysis pages
Use Performance to connect historical results with your current match analysis.
| Page | Question it answers | Analytical role |
|---|---|---|
| AI Radar | How are games organized by segment? | Compare games in segments of simulated historical performance. |
| Performance | How do Sample, Hit Rate, and Return vary across leagues? | Compare segments by Sample, Hit Rate, and Return. |
| Upcoming Matches | Which games, markets, and odds are available? | Broad exploration of games, markets, and odds. |
| Upcoming Games with EV+ | Which scenarios show positive EV under the estimate? | Compare divergences between estimated probability and price. |
| Upcoming Games with High Probability | Which scenarios show the highest estimated probability? | Sort scenarios by estimated probability. |
Think of it this way: AI Radar and Performance organize samples, and the analysis pages deepen the reading.
Practical example in football
Imagine you opened Performance and saw three leagues in the 1x2 market:
| League | Sample | Hit | Return |
|---|---|---|---|
| Brasileirão Série A | 180 games | 55% | +6% |
| Série B | 42 games | 64% | -2% |
| State Championship X | 9 games | 78% | +18% |
A rushed reading would look only at the state championship. A methodical reading notices another story:
- the state championship has a very small base, so the number may be inflated by a few games;
- Série B has a high hit rate, but Return below zero, so the odds change the reading of the history;
- Brasileirão Série A has a more robust base and Return above zero, so it offers a different historical profile for comparison.
If, in the EV+ tab, Brasileirão continues with Return above zero and a good Base, that sample can be compared with the other leagues.
What happens when you click on a league?
When you click on a league within Performance, Predora.si takes that reading to the page most consistent with the selected tab.
| Performance tab | Where the league should lead | Why |
|---|---|---|
| All | Upcoming Matches | You want to explore all games in that league. |
| High Prob | Upcoming Games with High Probability | You want games with higher probability. |
| EV+ | Upcoming Games with EV+ | You want to analyze scenarios with positive expected value. |
The league filter follows your navigation. This shortens the path between discovering where the model is performing best and analyzing the actual games of that competition.
How to use Performance by League in practice
1. Check which is the Active Model
Performance shows the performance of the active model. If you switch models, the reading by league may change.
2. Compare the selected market
The same championship can perform better in 1x2 than in Over 2.5 goals, or better in Both teams to score than in corners.
3. Base as a dimension of the sample
Base helps size the sample. A very high Return value with a tiny Base should be treated as an initial signal, not a conclusion.
4. Compare Hit Rate and Return together
Hit Rate shows the frequency of correct results. Return shows the model's simulated historical result considering the odds. Compare both with a relevant Base.
5. Compare the tabs of the same market
All gives an overview, High Prob focuses on higher probability, and EV+ brings together positive mathematical divergences.
6. Open the league and contextualize the games
Performance organizes the sample. The analysis deepens with observed odds, estimated probability, EV, market factors, and game context.
How to interpret in the long term
Performance by League reveals where the model has performed well and how results vary between competitions. Compare sample size, hit rate, Return, and recent periods to investigate the patterns.
Do not judge by a single game
One bad match alone does not invalidate a sample with a good base.
Do not chase results
Performance allows you to compare the process without turning an isolated negative result into a conclusion.
Give weight to larger samples
Small samples can look perfect by chance.
Compare within the same context
League, market, tab, and model must be the same for the comparison to make sense.
How to apply it on Predora.si
Performance organizes a comparison flow by league:
- Active Model: identify the model in use.
- Market: select the market to keep a comparable sample.
- Compare the leagues by Base, Hit Rate, and Return.
- Tabs: compare All, High Prob, and EV+ without mixing criteria.
- League: open the sample whose data will be interpreted.
- Games: compare the scenarios on the corresponding page.
- Interpret odds, EV, factors, and context to compare convergences and divergences.
Common mistakes when using Performance by league
1. Only looking at the highest Return value
A high Return value without sufficient Base may just reflect noise.
2. Ignoring the sample
Base is the sample size. Without it, Hit Rate and Return are ungrounded.
3. Comparing different tabs as if they were the same
All, High Prob, and EV+ answer different questions.
4. Assessing performance from a single result
Compare results across leagues and periods to investigate the model’s historical strengths.
5. Using Performance without looking at the market
The league may be good at Double Chance and weak at Over 2.5 goals.
6. Forgetting to review the odds
A good model reading loses value if the offered odds are poor.
Practical checklist
- Active Model: identify the model in use.
- Market: identify the selected market.
- Sample: size up the league's sample size.
- Hit rate: assess whether the percentage seems consistent or inflated by a few games.
- Return: compare the simulated historical result considering the odds.
- Tab: differentiate All, High Prob, and EV+.
- Segment: keep league, market, model, and tab comparable.
- Comparison: after clicking, interpret odds, EV, and game factors.
- Criterion: do not mix a conservative filter with a value filter.
- Expectation: compare performance across periods to assess the consistency of the pattern.
How does Performance fit into the analytical workflow?
Before analyzing games
Helps organize which leagues to analyze first.
When the day has many games
On a full slate, Performance helps cut through the noise and start with the leagues that have the best historical record in the filter.
When comparing models
If you use custom models, the page helps compare how each model behaves across leagues and markets.
When you want to combine it with AI Radar
Compare the historical record by league, then use AI Radar to open highlighted games and review factors.
Performance shows the breakdown by league. AI Radar organizes related games. AI + Stats lets you compare model signals.
FAQ about Performance by league
What is Performance by League on Predora.si?
Performance by League is the page that shows in which competitions the Active Model has been performing best, comparing Base, Hit Rate, and Return to organize the analysis by league.
Does Performance predict the result of the next game?
Performance shows historical results by league. Use sample size, hit rate, and Return to compare competitions and investigate the model’s strengths.
Which metric is most important: Base, Hit Rate, or Return?
All three need to be read together. Base shows the sample size, Hit Rate shows the frequency of correct results, and Return shows the model's simulated historical result considering the odds.
What does EV+ mean in Performance?
EV+ is the filter of games in which the model indicated positive expected value. This tab lets you compare how these scenarios appear across leagues.
When should I use High Prob?
Use High Prob to compare leagues in the filter of games with the highest estimated probability. Interpret the filter alongside odds, EV, and factors.
Why can a league with a high hit rate have poor simulation?
Because a high hit rate can come from low odds. If the odds pay little, a small string of errors can wipe out many correct picks. That is why Return is just as important as Hit Rate.
Can I compare Brasileirão, Série B, and Libertadores?
Yes, as long as the comparison uses the same Active Model, market, and filter. Then read Base, Hit Rate, Return, and the context of each competition.
On Predora.si, you can use Performance to compare leagues and then dive deeper into the analysis in Upcoming Games, EV+, or Strong Favorite.
Performance is the map, not the final destination
The Performance page helps you organize your analysis by league in football. Instead of analyzing everything in the dark, you start with the leagues where the active model shows the best combination of Base, Hit Rate, and Return.
After choosing the league, interpret each game with market, odds, EV, factors, and context. That is how Predora.si supports a routine with less guesswork and more method.