Direct answer
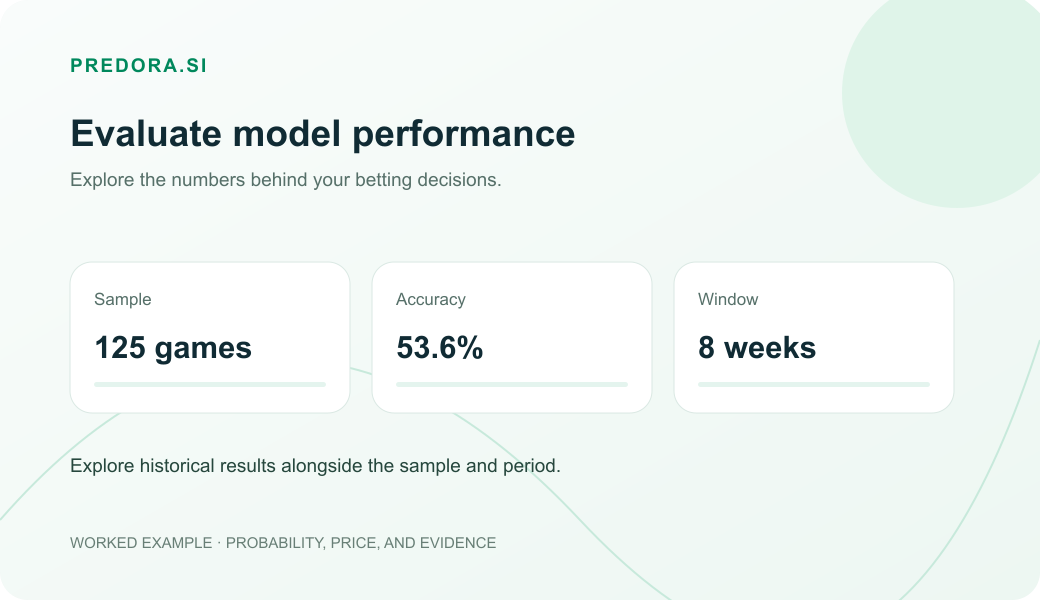
Accuracy rate shows how many bets were correct. Return shows whether those bets actually generated a positive result considering the odds. In football betting, hitting more does not automatically mean profiting more, because a strategy with many low odds can have a high hit rate and poor return. The ideal is to analyze hit rate, return, and base together.
Quick summary
| Concept | What it measures | Formula or logic | Common mistake | How Predora.si helps |
|---|---|---|---|---|
| Accuracy rate | How many bets hit within a sample. | (hits ÷ total bets) × 100 | Thinking a high hit rate always leads to profit. | Shows hit rate in the Active Model and in the Hit History. |
| Return / ROI | Result considering wins, losses and odds. | (net profit ÷ total staked) × 100 | Ignoring that low odds require a high hit rate. | Shows Return in the Active Model, in Performance, and in the Return History. |
| Sample | How many games are included in the calculation. | Number of games or bets in the filter. | Drawing strong conclusions with few games. | Appears by league, market, and filter type. |
| positive EV | If the odds pay above the estimated probability. | EV = (probability × odds) − 1 | Reading EV without checking its assumptions. | Upcoming Games with EV+ organizes scenarios with positive EV. |
| High probability | Bets with the highest estimated chance of hitting. | Probability cutoffs, such as 60% or more. | Confusing high probability with good price. | Upcoming Games with High Probability organizes selections with the highest probability. |
Hit rate measures the frequency of hits; return measures whether the hits financially compensated for the losses, considering the odds.
Hit rate is not the same as return
In football, it's common to look at a strategy and think: if I'm hitting a lot, then I'm doing well. The first reading seems logical, but a key piece is missing: odds don't all carry the same weight.
A bet at odds 1.35 doesn't pay the same as a bet at odds 2.20. Therefore, two strategies can have very different hit rates and, even so, the strategy with a lower hit rate can deliver a better return.
Accuracy rate answers: how many times did I get it right?
Return answers: was this worth it at these odds?
Sample answers: does this number have enough sample for me to take it seriously?
The mistake is trying to choose a strategy by looking at only one of these metrics.
How to calculate hit rate and return
Hit rate is the simplest part of the reading:
Hit rate = (number of hits ÷ total number of bets) × 100Return / ROI = (net profit ÷ total staked) × 100Example: 58 hits in 100 bets represent 58% hit rate. This shows consistency, but it still doesn't show whether there was a positive return.
To know whether the strategy was good, you need to look at the price you were getting on the odds. A hit rate of 58% can be great at average odds of 2.00, but weak at average odds of 1.50.
If you always bet 1 unit per game, the logic becomes clear: when you hit at odds 2.00, you profit 1 unit; when you hit at odds 1.50, it profits 0.50 units; when it misses, it loses 1 unit.
So return doesn't depend only on hitting. It depends on how much you win when you hit and of how much it loses when it misses.
The formula that explains it all: minimum hit rate
There is a direct way to understand why low odds require a very high hit rate.
Minimum hit rate to break even = 1 ÷ average oddsThis is the hit rate needed to stay at zero, with no profit and no loss.
| Average odds | Approximate minimum hit rate to break even | Practical reading |
|---|---|---|
| 1.30 | 76,9% | You need to hit a lot for it to be worth it. |
| 1.50 | 66,7% | High hit rate may still not be enough. |
| 1.80 | 55,6% | Requires good consistency. |
| 2.00 | 50,0% | Half of the hits already break even. |
| 2.20 | 45,5% | You can profit even by missing more than half. |
| 3.00 | 33,3% | Low hit rate can be sufficient if there is value. |
A strategy with 60% hit rate looks strong. But if the average odds are 1.40, it can lose money, because the minimum rate to break even at those odds is close to 71,4%.
Examples in football: high hit rate can produce poor return
Imagine a strategy in Brasileirão games focused on more conservative selections, such as favorites in Double Chance or higher-probability lines.
| Total bets | 100 |
|---|---|
| Average odds | 1.40 |
| Hits | 60 |
| Misses | 40 |
| Accuracy rate | 60% |
Profit on hits = 60 × 0.40 = +24 units Loss on misses = 40 × 1 = -40 units Final result = -16 units Return = -16%Even with 60% hit rate, the strategy ended up negative because the odds were too low for that level of hit rate.
Now look at a strategy with a lower hit rate
A strategy more focused on value bets can miss more and still end up positive if the price compensates.
| Total bets | 100 |
|---|---|
| Average odds | 2.20 |
| Hits | 48 |
| Misses | 52 |
| Accuracy rate | 48% |
Profit on hits = 48 × 1.20 = +57.6 units Loss on misses = 52 × 1 = -52 units Final result = +5.6 units Return = +5.6%Here the strategy missed more than it hit, but it ended up positive. This doesn't mean higher odds are automatically better. It means that price and probability need to work together.
Where does EV come into this comparison?
The EV, or expected value, is the bridge between probability and return.
EV = (estimated probability × odds) − 1If the model estimates a chance of 55% and the offered odds are 2.00, the calculation becomes:
EV = 0.55 × 2.00 − 1 EV = 1.10 − 1 EV = +0.10 EV = +10%This means that, according to that estimated probability, the odds are paying above the fair price.
Positive EV compares the estimate with the price. Review results across similar bets to see how actual performance relates to that expectation.
High probability and value betting answer different questions
| Type of reading | Main focus | What usually happens | Related area |
|---|---|---|---|
| High probability | Hitting more often. | Lower odds and not always positive return. | Upcoming Games with High Probability. |
| Value bet | Getting a price above fair value. | More fluctuation, but better long-term logic. | Upcoming Games with EV+. |
| Performance by league | Finding out where the model performs best. | Helps compare historical simulated performance filters. | Performance. |
The page Upcoming Games with High Probability makes sense when you want to start with scenarios with the highest estimated probability. The page Upcoming Games with EV+ makes sense when you want to look for odds the model understands are paying above fair value.
How to interpret hit rate and return in the long run
In the short term, everything seems more dramatic. A bad week can make it look like the model broke. A very good week can make it seem like you found a perfect formula. Both readings can be wrong.
Sample
How many games were included in the calculation? Few games make any number more volatile.
League
Is the filter from all leagues or from a specific competition?
Market
Are we talking about 1x2, Double Chance, goals, BTTS or corners?
Filter
Does the reading come from All, High Probability, EV+, or another filter?
Odds
Were the odds good enough to compensate for the misses?
Trend
Is there a pattern in the weekly return or just an isolated peak?
How to apply this on Predora.si
On Predora.si, this comparison appears practically in areas that help you look at hit rate, return, and sample within the same context.
1. Active Model
The Active Model card shows the model in use, filtered league, selected market, Sample, Hit Rate, and Return. The Sample sizes the subset, the Hit Rate shows frequency, and the Return describes the simulated historical result considering the odds.
2. Hit Rate History
The history helps you see whether the model has been hitting consistently week after week. It's great for consistency, but it doesn't close the analysis on its own.
3. Return History
This history compares Hit Rate and simulated result considering the observed odds and the selected subset.
4. Performance by league
Performance lets you compare the Active Model across leagues, considering Sample, Hit Rate, and Return.
5. Upcoming Games with EV+ and Upcoming Games with High Probability
Upcoming Games with High Probability organizes higher-probability scenarios. Upcoming Games with EV+ organizes scenarios with positive EV. One reading does not replace the other.
Chance, Hit Rate, EV, odds, Sample, and Return describe different dimensions and should be interpreted within the same subset.
Common mistakes when comparing hit rate and return
1. Thinking a high hit rate always means profit
It doesn't. If the odds are too low, you can hit often and still end up negative.
2. Ignoring the average odds
Without odds, the hit rate is incomplete. Hitting 55% at an average odds of 1.50 is different from hitting 55% at an average odds of 2.10.
3. Comparing different markets as if they were the same
1x2, Double Chance, Over 2.5 goals, Both Teams to Score, and corners behave differently.
4. Drawing conclusions from a small sample
A small sample of games can look amazing or terrible due to pure noise.
5. Switching models because of one bad week
A bad week is part of the game. If you keep changing your criteria, you'll never truly evaluate the strategy.
6. Mixing different filters
Don't compare hit rate in All with return in EV+. The filter needs to be the same: market, league, model, and subset.
7. Skipping the estimate behind EV
EV compares a probability estimate with the price. Review both the assumptions and the results across a series of similar bets.
Practical checklist before trusting a strategy
- Choose the market: 1x2, Double Chance, Over 2.5 goals, Both teams to score or Over 9.5 corners.
- Filter the league: avoid drawing conclusions from the aggregate alone.
- Check the base: compare sample size to assess the depth of the evidence.
- Compare hit rate and return in the same sample: same model, league, market, and filter.
- Look at the average odds: ask whether the hit rate is sufficient for the odds captured.
- Check whether there's positive EV: return needs to align with EV and the best available odds.
- Compare the game with factors and context: head-to-head data helps support the reading.
- Avoid changing criteria constantly: a strategy can only be evaluated when the process is consistent.
Main formulas
Hit rate = (hits ÷ total bets) × 100Return / ROI = (net profit ÷ total staked) × 100Minimum hit rate to break even = 1 ÷ average oddsEV = (estimated probability × odds) − 1These four formulas help separate feeling from math.
FAQ about hit rate and return
How do hit rate and odds combine to produce a return?
Return depends on the payouts from winning bets and the stakes lost on losing bets. Compare hit rate with odds and stake sizes to understand the result.
Is it possible to have positive return with less than 50% hit rate?
Yes, depending on the odds. If you bet at average odds above 2.00 and get value prices, it's possible to have positive return even while hitting less than half.
What matters more: hit rate or return?
It depends on the question. Hit rate measures consistency. Return measures the result considering the odds. To evaluate a strategy, the ideal is to look at hit rate, return, and base together.
Why can the return change by league?
Because each league has its own behavior, different game volume, different odds, and different levels of predictability for the model.
Is Upcoming Games with High Probability better than Upcoming Games with EV+?
It's not a matter of better or worse. Upcoming Games with High Probability organizes high-chance scenarios, while Upcoming Games with EV+ organizes scenarios with positive EV. They are different analytical subsets.
How should I interpret positive EV?
Positive EV compares the offered price with the fair odds implied by an estimate. Read it alongside hit rate, Return, and sample size to evaluate the approach.
On Predora.si, you can compare chance, EV, best odds, sample, Hit Rate, and Return by market and league. The platform organizes these dimensions for independent comparison, without determining an action.
Closing
Hit rate is a useful metric, but incomplete. Return shows whether the hits offset the losses, and sample shows whether the reading has enough weight to guide a decision.
In football, where variance is high and a single moment changes everything, the best path is to compare hit rate, return, odds, and sample within the same market, league, and model.