Direct answer
Yield in betting is the percentage of net result relative to the total amount staked. It shows how much a strategy returned, or lost, for each unit invested.
The usefulness of yield lies in the long term: it doesn't tell you whether the next bet will win, but it helps assess whether a strategy was efficient within a sample of bets.
Quick summary
| What does it measure? | Net result relative to the total volume staked. |
|---|---|
| Formula | Yield (%) = (net profit ÷ total amount staked) × 100 |
| What is it for? | To measure the efficiency of a strategy over a sample of bets. |
| Good sign | Positive yield over a relevant and well-recorded sample. |
| Common mistake | Confusing yield with hit rate or drawing conclusions from a small sample. |
| How Predora.si helps | Shows Return, Sample, filters by market or league, and the model's performance history. |
Yield is the percentage of net profit or loss over the total amount staked, used to measure the efficiency of a betting strategy over the long term.
How does yield work?
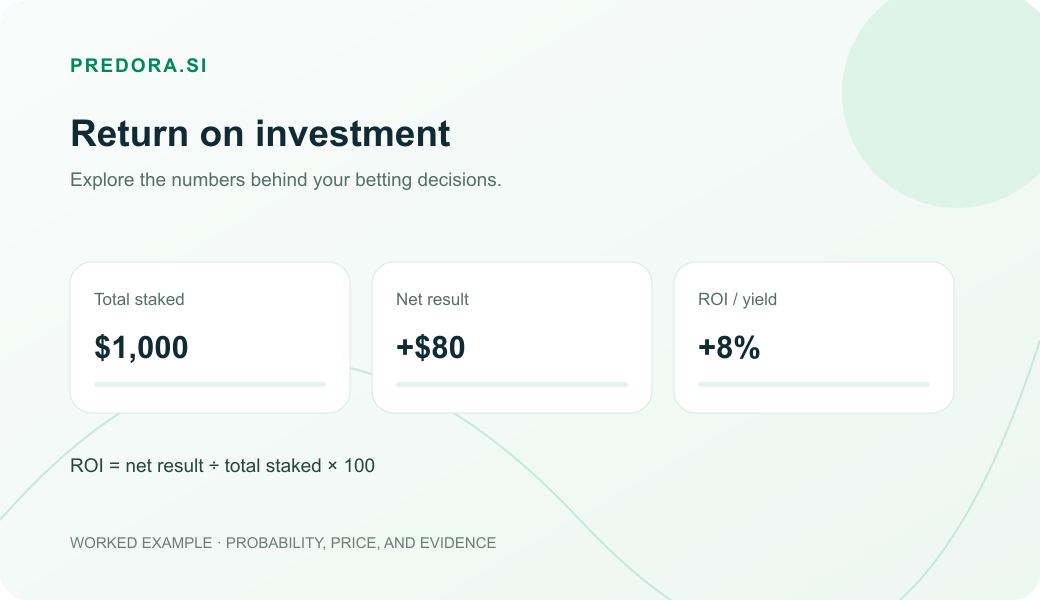
Yield looks at a sequence of bets and compares the net result of that sequence with the total staked. In plain Portuguese:
- if you staked 100 units in total;
- you ended with +8 units of net result;
- the yield for this sample was +8%.
This metric shifts the focus away from a single bet and places the analysis on the process. The question stops being "did I win or lose this game?" and becomes "is this strategy being efficient over the sample?".
This matters especially in football, because even good decisions can lose in the short term. A missed penalty, a red card, a set piece, or a lineup change can turn a match around.
Yield formula in betting
Yield (%) = (net profit ÷ total amount staked) × 100Yield (%) = (net units won ÷ units staked) × 100| Net profit | Final result after adding up gains and losses. |
|---|---|
| Total amount staked | Sum of all stakes used in the sample. |
| Positive yield | Result above zero within that filter. |
| Negative yield | Result below zero within that filter. |
Example in football
Imagine you placed 50 bets on football games, always with 1 unit per bet.
| Total staked | 50 units |
|---|---|
| Total return | 54 units |
| Net profit | +4 units |
Yield = (4 ÷ 50) × 100 Yield = 8%In this example, the strategy had yield of +8%: an 8% net return on the amount staked across the 50-bet sample. Compare the same measure across periods to assess how consistently the approach performed.
Is positive yield always good?
In general, positive yield is a good sign, but it needs context. A +20% yield on just 5 bets could be just a good streak. Meanwhile, a +5% yield on 500 bets can be more relevant, because there's a larger statistical sample behind it.
1. Yield shows efficiency
It indicates whether the strategy generated results over the volume staked.
2. Sample shows weight
Small samples fluctuate a lot and can inflate conclusions.
3. Hit rate shows consistency
It helps understand frequency, but it doesn't replace return.
4. Odds and markets explain risk
Yield in 1X2 doesn't have the same dynamics as yield in BTTS or corners.
A number without context usually gives a skewed reading. Yield should go hand in hand with sample, average odds, market, league, and variance.
What is the difference between yield and ROI?
In everyday betting, many people use yield and ROI almost as synonyms. Both usually measure percentage return on the amount staked.
| Metric | Most common reading in betting |
|---|---|
| Yield | Strategy efficiency over the total volume staked. |
| ROI | Return on investment; in betting, often also used over the total staked. |
To avoid confusion, the most important thing is to make the calculation basis clear. If the calculation uses net profit ÷ total staked, we're talking about efficiency relative to the volume staked.
How the concept appears on Predora.si
On Predora.si, the concept closest to yield appears in the Return reading of the model, defined as simulated historical result considering the odds within a slice.
Active Model
Shows Hit Rate, Return, and Sample in the selected context.
Performance
Compares Active Model performance across leagues.
Return History
Shows the model's simulated weekly result to compare trend and fluctuation.
All, High Prob., and EV+
Allow comparing different slices without mixing criteria.
Return on Predora considers the odds and, when applicable, the best available odd among the compared bookmakers. In practice, yield helps interpret this number: it's not enough to know whether the model hit often; it also matters whether the odds were worth it.
Common mistakes when interpreting yield
1. Assessing yield without its sample and period
Yield measures the return on the total amount staked over the sample shown.
2. Drawing conclusions from too few bets
A short streak can produce very high or very low yield due to variance.
3. Comparing different markets without context
1X2, Over 2.5 goals, BTTS, and corners have different prices, risks, and samples.
4. Confusing hit rate with return
A strategy can hit quite often and still have poor yield if the odds are low.
5. Increasing stake because of a good run
Positive yield does not replace bankroll management, fixed units, and process discipline.
Practical checklist before trusting yield
- What was the total amount staked? Without staked volume, the percentage is left floating.
- What was the net profit or loss? Use net result, not gross return.
- How many bets are in the sample? Compare the number of bets behind the percentage.
- Is the sample the same? Compare the same league, market, model, and filter.
- Do the odds used make sense? Bad odds can turn hits into weak returns.
- Does the strategy have value logic? Compare performance across several periods.
- Is there bankroll management? Yield does not protect against emotional staking.
Use the EV calculator to compare probability, odds, and stake. Then read the result together with sample size, return, and variance before turning any number into a decision.
FAQ about yield in betting
Does high yield mean the strategy is safe?
Read yield alongside sample size and time period. Comparing more observations helps you assess the consistency of a strong result.
Does negative yield mean the strategy is bad?
A negative yield can reflect a short run, a particular segment, or a weak approach. Compare sample size and periods to investigate which explanation fits the evidence.
Is yield better than hit rate?
They measure different things. Accuracy rate shows how many bets hit. Yield shows whether the financial result compensated for the staked volume.
Can I compare yield across different markets?
Compare the same markets and filters. A yield in 1x2 does not have the same dynamics as a yield in Over 2.5 goals, BTTS or corners. The ideal is to compare markets, leagues, and models using the same type of filter.
How do I use yield to evaluate a strategy?
Compare yield with sample size, time period, odds, and stake sizes. Equivalent filters help you assess how consistently an approach performed.
Yield is a process reading
Yield shows how efficiently an approach performed relative to the amount staked. Compare it with sample size, hit rate, odds, market, and time period.
On Predora.si, Return, Performance, Return History, and filters by market or league organize this concept for analysis.