Direct answer
Break-even probability is the minimum chance a bet needs to have to break even in the long run at a given odds. In decimal odds, it is calculated by 1 ÷ decimal odds.
If your estimated probability is higher than that number, there may be value. If it is lower, the odds probably don't pay enough for that estimated chance.
Quick summary
| Definition | Minimum chance needed for a bet not to go negative in the long run at a specific odds. |
|---|---|
| Formula | Break-even probability = 1 ÷ decimal odds |
| Also appears as | Break-even probability, minimum probability, break-even point. |
| Used for | Comparing the offered odds with the probability estimated by the model. |
| Quick example | Odds 2.00 require a 50% hit rate to break even. |
| Common mistake | Thinking break-even probability is a real match prediction. It isn't. It comes from the odds. |
| How Predora helps | Predora cross-references Active Model probability, EV, fair odds, edge, and odds comparison. |
Break-even probability shows the minimum an odds is requiring for you not to lose money in the long run.
How it works
Think of break-even probability as the required minimum for that odds to make sense. If a bookmaker offers odds 2.00, you need to hit more than 50% of the time to have an edge in the long run. If they offer odds 1.80, you need to hit more than 55,56%. If it offers odds 2.50, you need to hit more than 40%.
If the estimate is higher than the break-even point, there may be positive EV.
If it is equal, the bet is at the break-even point.
If it is lower, the odds don't pay enough for that estimated chance.
In other words: break-even probability shows what the odds are requiring from you.
Break-even probability formula
The formula for decimal odds is:
Break-even probability = 1 ÷ decimal oddsBreak-even probability (%) = (1 ÷ decimal odds) × 100Simple example
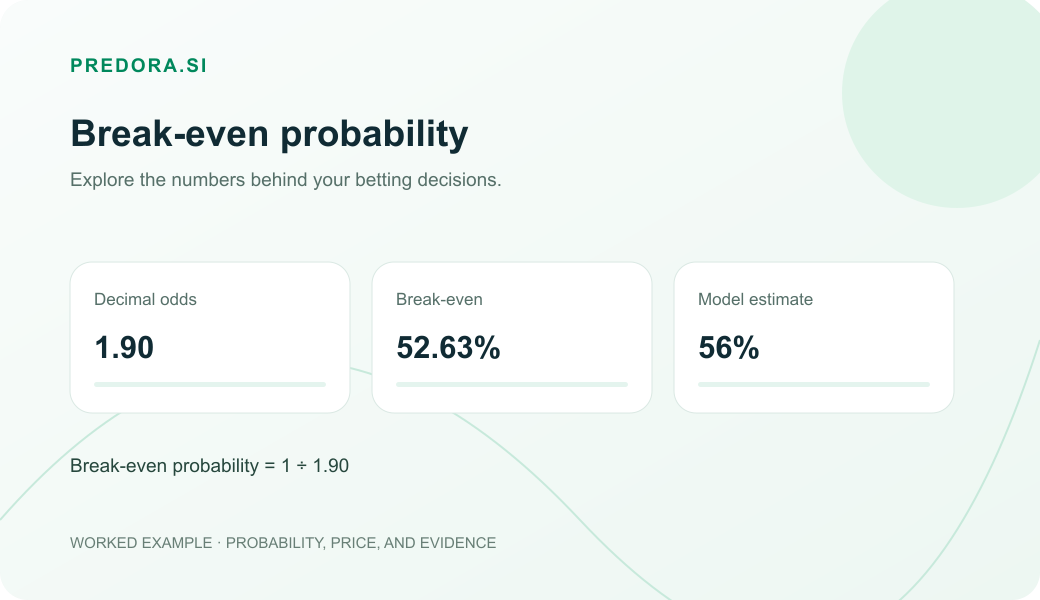
Odds = 1.90 1 ÷ 1.90 = 0.5263 0.5263 × 100 = 52.63%At these odds, you need more than 52,63% estimated chance to see an estimated difference.
Quick table: odds and break-even point
| Decimal odds | Calculation | Break-even probability |
|---|---|---|
| 1.50 | 1 ÷ 1.50 | 66,67% |
| 1.80 | 1 ÷ 1.80 | 55,56% |
| 2.00 | 1 ÷ 2.00 | 50,00% |
| 2.50 | 1 ÷ 2.50 | 40,00% |
| 3.00 | 1 ÷ 3.00 | 33,33% |
Example in football
Imagine a Brasileirão match in which the market Both Teams to Score - Yes is at odds 1.90.
Break-even probability = 1 ÷ 1.90 Break-even probability = 0.5263 Break-even probability = 52.63%This means that, at these odds, you would need the Both Teams to Score - Yes to happen in more than 52,63% of similar cases to have an edge in the long run.
| Scenario | Estimated probability | Odds break-even | Reading |
|---|---|---|---|
| Model estimates 50% | 50,00% | 52,63% | No value: the odds don't pay off. |
| Model estimates 52.63% | 52,63% | 52,63% | Break-even point. |
| Model estimates 56% | 56,00% | 52,63% | There may be value. |
If the Active Model estimates 56% and the odds are 1.90, the approximate EV would be:
EV = (0.56 × 1.90) - 1 EV = 1.064 - 1 EV = +0.064 EV = +6.4%The odds exceed the break-even threshold under this probability estimate. Compare the estimate with match factors to assess the price.
Break-even probability vs implied probability
In practice, the two concepts use the same calculation: 1 ÷ decimal odds. The reading changes a bit.
| Concept | What it means |
|---|---|
| Implied probability | The chance that the bookmaker's odds are pricing in. |
| Break-even probability | The minimum chance you need to avoid losing in the long run at those odds. |
With odds of 2.00, the bookmaker is pricing in something close to 50%. As a break-even point, you need more than 50% of estimated real chance to have an edge.
How it appears on Predora.si
On Predora.si, this concept appears behind the comparison between Active Model probability, best odds, fair odds, edge and EV.
1. The Active Model estimates the probability
The model calculates the chance of a selection in the selected market.
2. The best odds define the minimum threshold
The available odds can be converted into break-even probability.
3. The app compares chance and price
If the model's chance exceeds the break-even point, there may be an estimated difference.
4. EV and edge help compare prices
Upcoming Games and Upcoming Games with EV+ use this reading to compare the estimated price with intuitive opinion.
Simple example
Model probability = 54% Bookmaker odds = 2.05 Break-even probability = 1 ÷ 2.05 = 48.78%In this case, the model is estimating 54%, while the odds require about 48,78% to break even. This difference may indicate value, as long as the model's reading makes sense and the game context confirms it.
Common mistake
The most common mistake is thinking that break-even probability is the real chance of the game. It is not.
Break-even probability comes from the odds, not from a statistical analysis of the matchup. It does not know whether the home team is in good form, whether the away team rotates its squad, whether the game looks like it will have goals, or whether the league has a high average of corners.
What is the minimum chance needed for these odds not to be bad in the long run?
The estimated real chance needs to come from an analysis: model, data, context, market, and odds comparison.
Practical checklist
- Take the decimal odds of the bet.
- Calculate
1 ÷ odd. - Turn the result into a percentage.
- Compare with your estimated probability.
- If the estimate is higher, there may be value.
- If it is lower, the odds probably are not worth it.
- Compare market, league, team factors, and odds movement.
The reading starts from odds, converts the break-even point, and compares that value with the probability estimated by the Active Model.
FAQ about break-even probability
Is break-even probability the same as implied probability?
The calculation is the same: 1 ÷ decimal odds. The difference lies in the interpretation. Implied probability is the chance that the odd prices in. Break-even probability is the minimum chance needed for that odd to break even in the long run.
How do I use the break-even probability?
Compare the break-even percentage with your probability estimate. A higher estimate produces positive EV at that price; the size of the gap helps you compare scenarios.
The higher the odds, the lower the break-even probability?
Yes. Higher odds require a lower probability to break even. For example, odds of 3.00 requires 33,33%, while odds of 1.50 requires 66,67%.
Does break-even probability consider the bookmaker's margin?
In the simple reading of an individual odds line, it shows the break-even point of that price. In markets with multiple selections, such as 1x2, the sum of implied probabilities usually exceeds 100% because of the bookmaker's margin.
How do I know if there is value?
Compare the probability estimated by your model with the break-even probability. If the model estimates a higher chance than the odds require, there may be positive EV. Even so, it is worth reviewing odds, factors, and context before deciding.
Next steps
Break-even probability helps turn odds into an objective question: is the estimated chance higher than the minimum the odds require?
To go deeper, read about implied probability, fair odds, and expected value. Then use the tools to test real odds against your own estimates.