Direct answer
Bankroll management is the method used to relate bankroll, unit, and exposure over time. In value betting, even a selection with positive EV can lose in the short term.
The bankroll serves as a reference for measuring exposure, variance, and results on a consistent scale.
Quick summary
| Point | Summary |
|---|---|
| Definition | Relate bankroll, unit, and stake on a common exposure scale. |
| Basic formula | Unit = bankroll × chosen percentage |
| When to use | In exposure and variance analyses, including positive EV strategies. |
| Common mistake | Interpreting a larger stake as a higher probability or as an automatic consequence of EV. |
| How Predora.si helps | Organizes Chance, EV, best odds, Return, and Factors for analytical comparison. |
Bankroll management is the set of rules that relates the bankroll to exposure per bet to measure the effect of variance over the long term.
What is bankroll management in value betting?
Bankroll management treats the bankroll as a measurable monetary base. The bankroll, the unit, and the number of units per bet form a scale for comparing different records.
In the context of value bets, this comparison becomes especially useful. A value bet has odds above the fair price implied by the probability estimate.
A series with positive estimated EV can show several consecutive losses without a short sample determining the quality of the model. The bankroll allows expressing the effect of that variance on the same scale.
Why does bankroll management matter so much in positive EV?
Why Positive EV measures expectation, based on the probability estimate and price.
EV = (estimated probability × odds) − 1If the EV is positive, it means the odds are paying above what the estimated probability suggests. But that does not eliminate an unexpected draw, own goal, red card, missed penalty, VAR, surprise lineup, or a goal conceded at the end.
How much does a sequence of results change the bankroll at each stake scale?
The answer depends on the ratio between stake and bankroll, not on EV in isolation.
Bankroll, unit, stake, and ROI: what is the difference?
| Term | What it means | Simple example |
|---|---|---|
| Bankroll | Separate amount for betting only. | $1.000 |
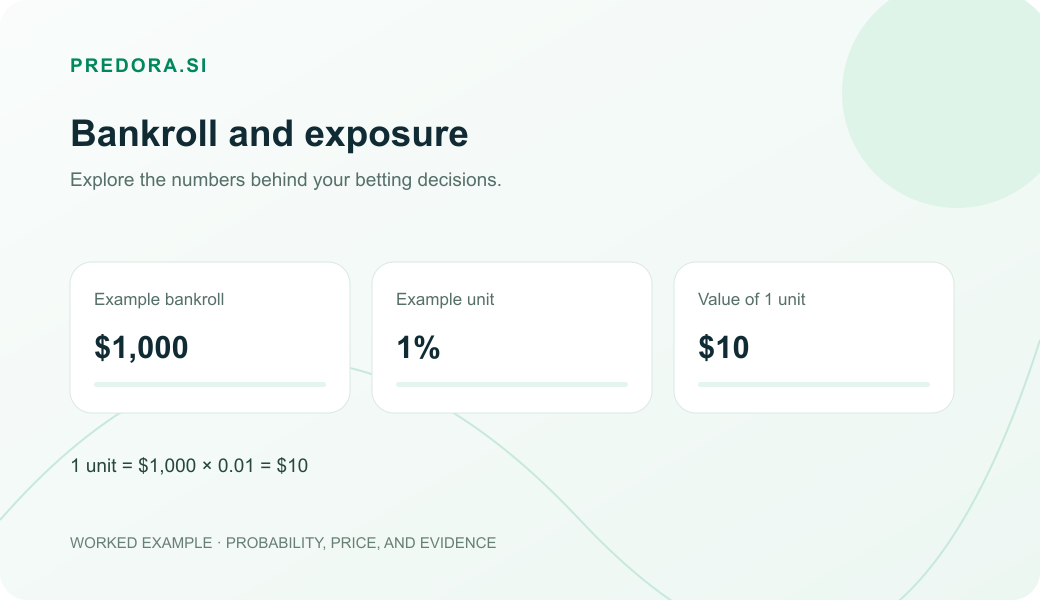
| Unit | Standard bet size. | 1% of bankroll = $10 |
| Stake | Amount used in a specific entry. | 1 unit, 1.5 units, or 2 units |
| ROI / return | Percentage result of the strategy. | +6% on a betting base |
| Drawdown | Accumulated bankroll decline in a bad streak. | Bankroll dropped from $1,000 to $900 = -10% |
The bankroll is the tank. The unit is the gear. The stake is how much you accelerate. ROI shows whether the path is working. Drawdown shows how much the ride swayed.
Mathematical relationship between bankroll and unit
In the educational concept, the bankroll is a specific monetary base, separate from other financial categories. The page does not establish or recommend a bankroll amount.
Bankroll = money set aside exclusively for betting Unit = bankroll × unit percentageIn a hypothetical scenario with a bankroll of $1,000, the values below show only the nominal equivalence of different percentages.
| Unit percentage | Value of 1 unit with a bankroll of $1,000 |
|---|---|
| 0,5% | $5 |
| 1% | $10 |
| 1,5% | $15 |
| 2% | $20 |
Larger percentages represent potentially larger exposures and swings as well. The table is comparative and does not prescribe exposure values.
Comparison of unit scales
| Simulated scale | Unit size | Proportional effect | Analytical note |
|---|---|---|---|
| Scale A | 0.5% of bankroll | Smaller nominal variation per result. | High probability does not imply positive estimated value. |
| Scale B | 1% of bankroll | Intermediate nominal variation. | Exposure does not change probability or EV. |
| Scale C | 1.5% to 2% of bankroll | Greater exposure to variance. | The same sequence produces larger nominal swings. |
| Scale D | Above 2% frequently | High swing relative to the bankroll. | Samples become more sensitive to short sequences. |
These examples show how the same results affect a bankroll at different stake sizes.
Football example: positive EV at two stake scales
Imagine a Brasileirão Série A match in the market 1x2. The model estimates 52% probability, the best available odds are 2.05, the bankroll is $1,000, and the unit is 1% of the bankroll.
EV = (0.52 × 2.05) − 1 EV = 1.066 − 1 EV = +0.066 EV = +6.6% Stake = $10 Theoretical monetary EV = $10 × 6.6% = $0.66That $0.66 is the expected average return per bet under this probability estimate and price. Compare repeated similar bets to explore how actual results vary.
With a stake of $10
6 losses × $10 = -$60 Drawdown = -6% of bankrollThe simulated drawdown equals 6% of bankroll.
With a stake of $100
6 losses × $100 = -$600 Drawdown = -60% of bankrollThe simulated drawdown equals 60% of bankroll.
Fixed, proportional, and Kelly stake: comparison of methods
The methods below calculate exposure in different ways and are presented only for mathematical comparison.
| Method | How it works | When it makes sense | Risk |
|---|---|---|---|
| Fixed stake in units | Each record uses 1 standard unit. | Comparisons with uniform exposure. | Can be too rigid in very different scenarios. |
| Stake proportional to bankroll | The unit is recalculated as the bankroll changes. | Comparisons proportional to growth or decline. | Recalculating all the time can cause anxiety. |
| Confidence-based stake | Exposure varies according to a confidence scale. | Requires explicit and reproducible criteria. | Easily turns into emotion. |
| Fractional Kelly | Uses probability and odds to calculate a theoretical fraction of the bankroll. | It is an advanced reading that is sensitive to model calibration. | Full Kelly can be too aggressive. |
Kelly formula, decimal version
Kelly = ((odds − 1) × p − (1 − p)) ÷ (odds − 1)With 52% probability and odds of 2.05, full Kelly is close to 6.3% of bankroll. Fractions such as 1/4 or 1/8 Kelly reduce the calculated stake, letting you compare smaller exposures under the same assumptions.
How the bankroll scale changes over time
Recalculating the unit after each result and reviewing at defined intervals produce different scales.
| Situation | Effect on the scale |
|---|---|
| Bankroll rose about 20% | The same percentage now represents a larger nominal value. |
| Bankroll fell about 20% | The same percentage now represents a smaller nominal value. |
| Had a short bad streak | A short sample may reflect variance, without changing the formula. |
| Changed model, market, or league | The new base is no longer directly comparable to the previous one. |
| Records use inconsistent criteria | The comparability of the series is compromised. |
If the bankroll goes from $1,000 to $1,200, a 1% unit becomes $12. If it drops to $800, the unit becomes $8. The nominal equivalence follows the change in the reference base.
Bankroll management allows comparing exposures
Bankroll management is not just a percentage per bet. It also allows identifying patterns that compromise the consistency of records.
Larger exposure after a loss
Loss recovery changes the scale and makes it difficult to compare records.
Selection motivated only by game visibility
Visibility does not change probability, price, or EV.
Associating high EV with a larger stake
EV, base, context, and variance are distinct dimensions of the analysis.
Switching models after a bad week
A week may reflect variance; base and period contextualize the sample.
How to interpret bankroll management in the long term
Long-term reading quantifies declines and swings relative to the reference bankroll, without eliminating them or predicting the next series.
| Element | What it answers |
|---|---|
| EV | Are the odds paying well for the estimated probability? |
| Variance | How much can the result fluctuate in the short term? |
| Bankroll management | What is the proportional effect of that swing on the bankroll? |
How the concepts appear on Predora.si
On Predora.si, bankroll management is a separate layer from the analysis. The app organizes estimates, prices, histories, and factors; the unit only expresses exposure on a common scale.
1. Active Model
The Active Model is the lens that calculates probability, fair odds, and EV in matches. If you switch models, the probabilities and EV may change.
2. Performance by league
Base, Hit Rate, and Return describe the simulated history of the Active Model in each league sample.
3. Upcoming Games with EV+
Upcoming Games with EV+ organizes matches in which the Active Model estimates positive EV, without constituting an action order.
4. Match factors
Match analysis, team comparison, and AI + Statistics allow interpreting context, market, and statistical signals.
5. Odds comparison
The same selection with odds of 1.90 and odds of 2.05 does not have the same EV. The comparison highlights how price changes the mathematical outcome.
6. Unit
A 1-unit rule maintains the same exposure reference across comparable records.
Upcoming Games with EV+ organizes estimates with positive EV; the factors and the unit represent complementary and independent readings.
How to combine EV, probability, and unit
EV defines whether there is value. Probability helps understand variance. Unit represents the exposure reported in the record.
| Scenario | Reading | Analytical context |
|---|---|---|
| Low EV and high probability | May be a tight odds line. | High probability does not imply positive value. |
| High EV and low probability | May have value, but a lot of variance. | Higher odds tend to amplify variance. |
| Positive EV and reasonable probability | More balanced scenario. | Probability and price present a more balanced relationship. |
| Positive EV, but conflicting factors | Math without clean context. | Conflicting factors increase the uncertainty of the estimate. |
| Negative EV | Odds do not compensate for the probability. | The observed price is below the estimated fair price. |
Factors that change the stake scale
Factors associated with a larger nominal scale
- the reference bankroll increased;
- the record base is larger;
- the Return varies within the observed sample;
- the same criterion was maintained over the period;
- the percentage now represents a larger nominal value.
Factors associated with a smaller nominal scale
- the bankroll dropped significantly;
- records no longer follow the same criterion;
- the market changed and the new base is smaller;
- the observed variance increased;
- recording criteria are no longer comparable.
Stake changes alter the exposure and comparability of records, even when probability and EV remain the same.
Common bankroll management mistakes
1. Mixing price analysis with stake sizing
Positive EV shows a price above the fair odds implied by the probability estimate.
2. Increasing stake after a loss
Recovery changes the scale and makes records less comparable.
3. Automatically associating high EV with a larger stake
High EV can come with higher odds and more variance; the metrics are not equivalent.
4. Using a different stake without a clear rule
Records at 1u, 3u, and 5u require normalization for proportional comparison.
5. Ignoring the best odds
Taking worse odds reduces EV. Comparing odds is part of the method.
6. Switching models after a short streak
A bad week can just be variance. Without consistency, you never understand what is working.
7. Not recording entries
Without records, you do not know if you are overexposed to a market, league, or odds type.
Analytical bankroll management checklist
- Bankroll: separate reference value for the record.
- Unit: corresponding percentage and nominal value.
- Active Model: lens used to estimate probability and EV.
- Sample: size of the league and market sample.
- EV: relationship between estimated probability and observed price.
- Chance: dimension that influences expected variance.
- Factors: signals that contextualize convergences and divergences.
- Odds: observed price used in the calculation.
- Stake: exposure recorded on the unit scale.
- Consistency: use of the same criterion in comparable records.
Simple analytical record model
A comparable series can include the following fields:
| Field | Example |
|---|---|
| Date | 16/06/2026 |
| League | Brasileirão Série A |
| Market | 1x2 |
| Model used | Predora AI Pro |
| Probability | 52% |
| Odds | 2.05 |
| EV | +6,6% |
| Stake | 1 unit |
| Outcome | Win/Loss |
| Return | +1.05u or -1u |
With consistent criteria, the record allows comparing market, league, stake, EV, and result on the same scale.
Series comparability criteria
The points below distinguish comparable series from series with criterion changes.
Consistent criteria
- same stake scale in the sample;
- same market and line in comparisons;
- model and probability identified;
- results analyzed by base and period.
Comparability breaks
- rule change between results;
- stake tied to the previous outcome;
- model, league, or market not identified;
- EV compared without context and without the same odds reference.
How Predora.si helps with bankroll management
Predora.si is not a bookmaker. It organizes data, estimates, and comparisons and keeps these metrics separate from the exposure scale.
| Management stage | How Predora.si helps |
|---|---|
| Compare scenarios | Upcoming Games with EV+ organizes games with positive EV in the Active Model. |
| Compare prices | Odds comparison gathers available prices for the same market. |
| Interpret history | Performance shows Base, Hit Rate, and Return by league. |
| Compare context | AI + Statistics / Factors shows game signals beyond probability. |
| Measure consistency | Return History and Hit Rate History help compare the model by period. |
| Compare models | Custom models allow testing estimates on equivalent samples. |
Performance → Upcoming Games with EV+ → Factors → Odds comparison → Units → RecordExposure does not change estimate quality
A smaller or larger stake does not fix a poorly estimated probability, odds below fair price, or an incompatible sample. Exposure changes the nominal effect of the result, not the quality of the model.
Bankroll management FAQ
What does the bankroll percentage represent?
The percentage converts the bankroll into a nominal unit. For example, 0.5%, 1%, 1.5%, and 2% represent progressively larger exposures and, therefore, potentially larger swings.
What does bankroll management help me measure?
It expresses stakes and results on a common scale, making it easier to compare exposure, drawdowns, and performance over time.
Does high EV imply a larger stake?
No. EV and stake measure different dimensions. High EV can come with higher odds and more variance, while stake measures exposure.
What happens when you double the stake after a loss?
Exposure doubles, the scale is no longer uniform, and the next potential loss increases. The operation does not change probability or mathematically recover the previous result.
How does recalculation change the unit?
Recalculation applies the percentage to the new bankroll value. Frequent revisions produce a different nominal series than revisions at defined intervals.
How does Predora.si relate to bankroll management?
Predora.si organizes scenarios with positive EV in Upcoming Games with EV+, histories in Performance, context in AI + Statistics and prices in the odds comparison. The unit remains a separate measure of exposure.
Conclusion: bankroll standardizes the exposure scale
Value betting evaluates price against probability. Bankroll, unit, and stake show how each result affects the money allocated to your betting approach.
Predora.si helps in this process by cross-referencing Active Model probability, best available odds, EV, Return History, and statistical factors. The platform does not determine action or stake size.